The Go backend platform had been established earlier in 2025 and eventually carried eighteen Go domain services. Product teams could ship features, but operational questions still required ad-hoc production queries. Dashboards were slow, and linked views could not be trusted to refresh from a consistent snapshot.
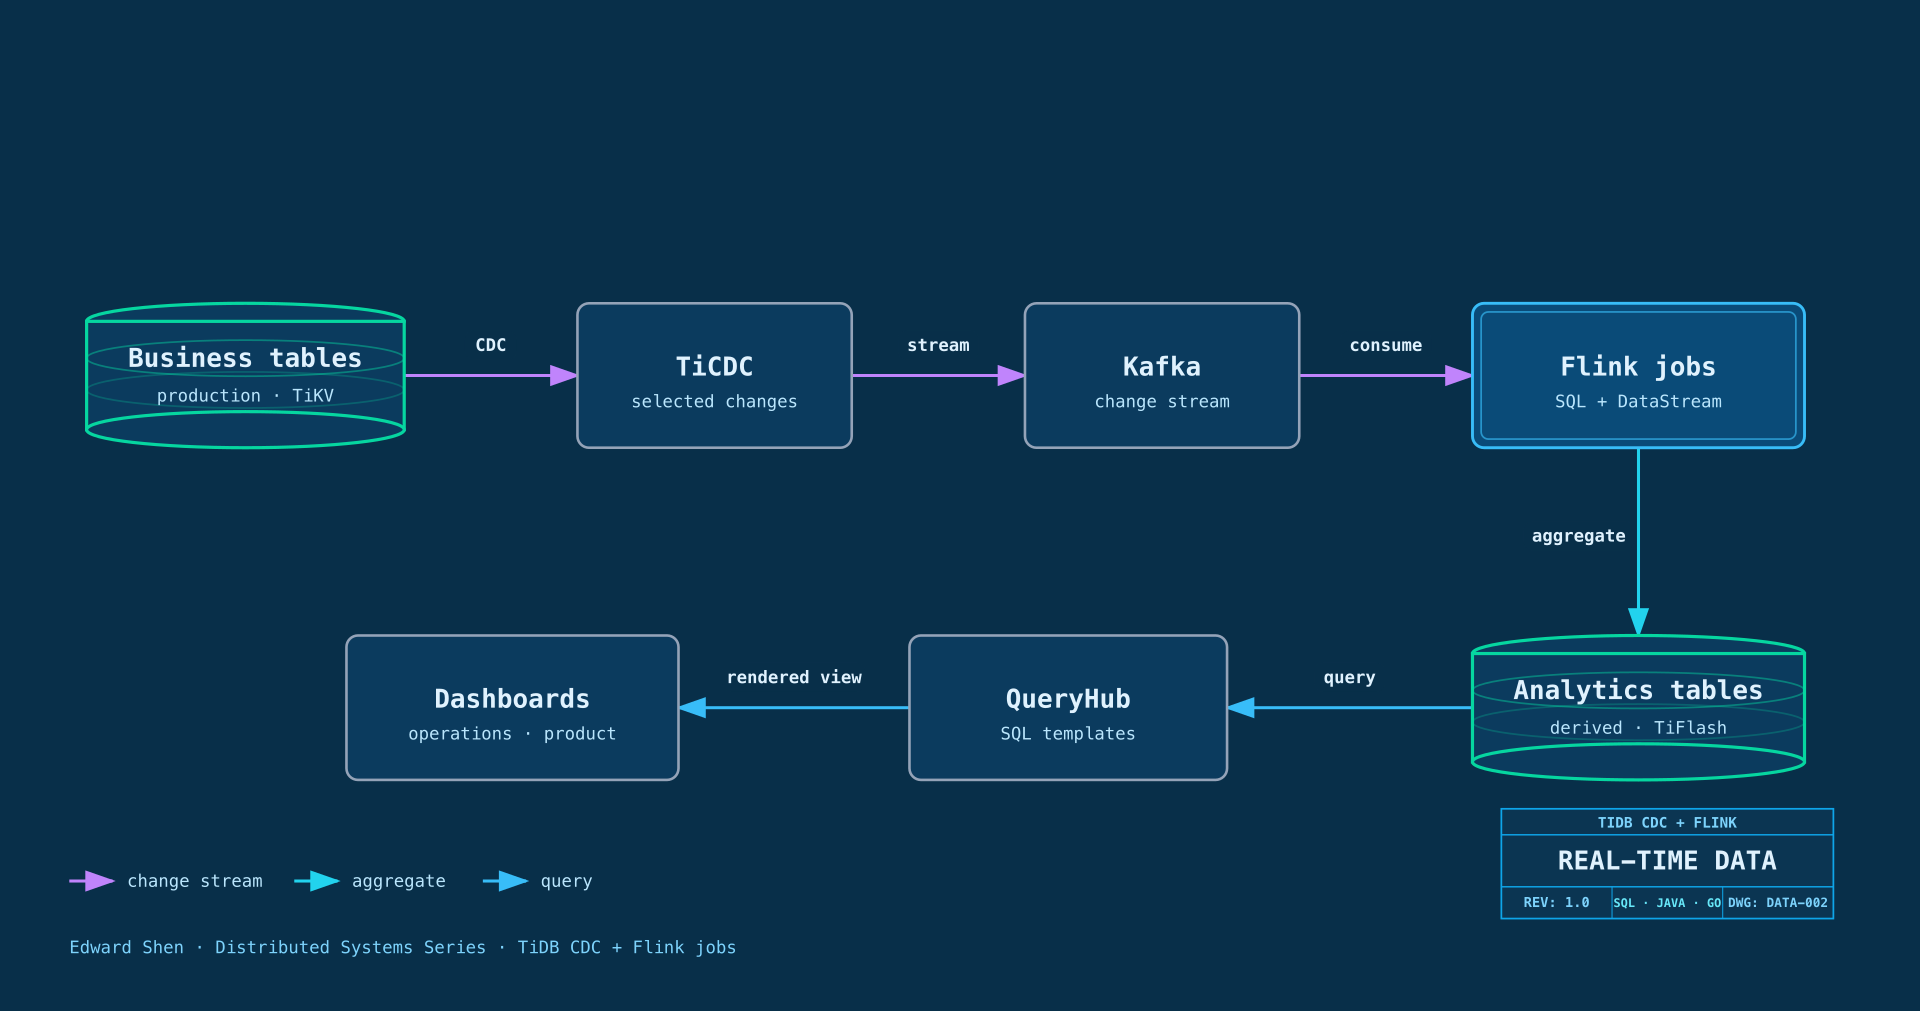
Four Go engineers had to build the data platform alongside feature delivery. We could not operate a separate OLAP database, sync pipeline, and dedicated data engineering function, so we built TiCDC → Kafka → Apache Flink → analytical tables in TiDB, served by QueryHub, a self-developed SQL-template service.
Context and requirements
The backend foundation came from Scaling Four Engineers to Eighteen Go Services with Generated Contracts. From June through November 2025, I initiated and led the architecture and rollout for the CDC path, warehouse layering, and query serving in a separate data-platform workstream. ConfigHub was part of that workstream.
Product managers needed transaction, settlement, and promotion metrics. Operations needed to detect abuse while a campaign was still active. Finance needed reconciliation. The production schemas were optimized for writes, not analytical reads.
The daily cost appeared in three ways: new metrics required ad-hoc production queries or a new ETL pipeline; metrics varied by dimension, granularity, and refresh requirement; and T+1 reporting was too slow for an active promotion-abuse investigation.
The product had a fast feature cadence, correctness-sensitive transaction flows, and live-ops reports that changed every sprint. We standardized on TiDB and required:
- Hourly aggregation of transaction, settlement, promotion, referral/commission, and wallet-transfer events.
- Multi-stream joins and dimension-table lookups for detail and wide-table analysis.
- Logical ODS → DWD → DWS layering with explicit ownership.
- Analytics tables updated within seconds rather than waiting for T+1 reports.
- Daily and monthly report boundaries in the viewer's timezone.
- Stable pipeline definitions deployed through the existing K8s and CI/CD path.
- Recoverability from TiCDC replay, Flink restarts, and batch corrections without duplicating aggregate rows.
Options Considered
| Decision | Alternatives considered | Selected | Why |
|---|---|---|---|
| Report access | Superset, self-developed QueryHub + existing admin UI | Self-developed QueryHub + React/ECharts | Kept dashboards product-owned and inside the admin experience |
| Change capture | Canal, direct Flink CDC, TiCDC | TiCDC → Kafka | Native TiDB capture; Kafka retained the changefeed while Flink checkpoints stored source offsets and job state |
| Storage/query | Separate OLAP store, TiDB + TiFlash | TiDB + TiFlash | Reused MySQL compatibility, joins, security, and operational knowledge |
| Processing API | Custom streaming pipeline, Flink SQL, DataStream | Flink SQL by default; DataStream for custom state and cleansing | Reused tested checkpoint, keyed-state, recovery, and backpressure primitives; kept common reports reviewable |
A custom streaming pipeline could keep business logic close to the services and avoid adopting another framework. We rejected it because it would have made the team own checkpoint/recovery behavior, state migration, event-time ordering, duplicate suppression, scaling, backpressure, and latency tuning. Flink did not remove those concerns, but it provided tested primitives for them. Sink correctness remained our responsibility.
Architecture / Design
The platform had two table groups—selected production tables and
derived analytical tables—and both were queryable through TiDB. Selected
production tables were stored in TiKV, with TiFlash
maintaining asynchronous columnar Raft Learner replicas. For derived
metrics, TiCDC sent selected changes to Kafka; Flink aggregated them and
wrote ads_* tables to TiDB over MySQL/JDBC; TiKV persisted
the rows and TiFlash maintained the serving replicas.
For the direct replicas, TiKV → TiFlash was a storage-engine operation rather than an external ETL job. One command enabled the replica:
1 | ALTER TABLE <source_table> SET TIFLASH REPLICA 1; |
TiFlash then bootstrapped existing rows through a Raft Learner
snapshot and applied subsequent Raft updates. We did not write a
separate full-load/backfill job, store high-watermark offsets, or run an
incremental sync process for those replicas. This did not eliminate
operational work: replica progress, storage headroom, IOPS, scans, and
compaction became part of the TiDB capacity model. The TiCDC → Kafka →
Flink path remained conventional ETL because it transformed selected
events into new ads_* aggregates.
Logically, the warehouse followed ODS → DWD → DWS, but ODS was not a
copied store. The selected business tables were the ODS layer; TiCDC
read them in place. Flink joined event streams and dimensions into
detail/wide tables for DWD, while SQL jobs materialized hourly
aggregates into ads_* DWS tables. Because all layers lived
in TiDB, the layering set naming, ownership, and refresh rules; it did
not require a separate database.
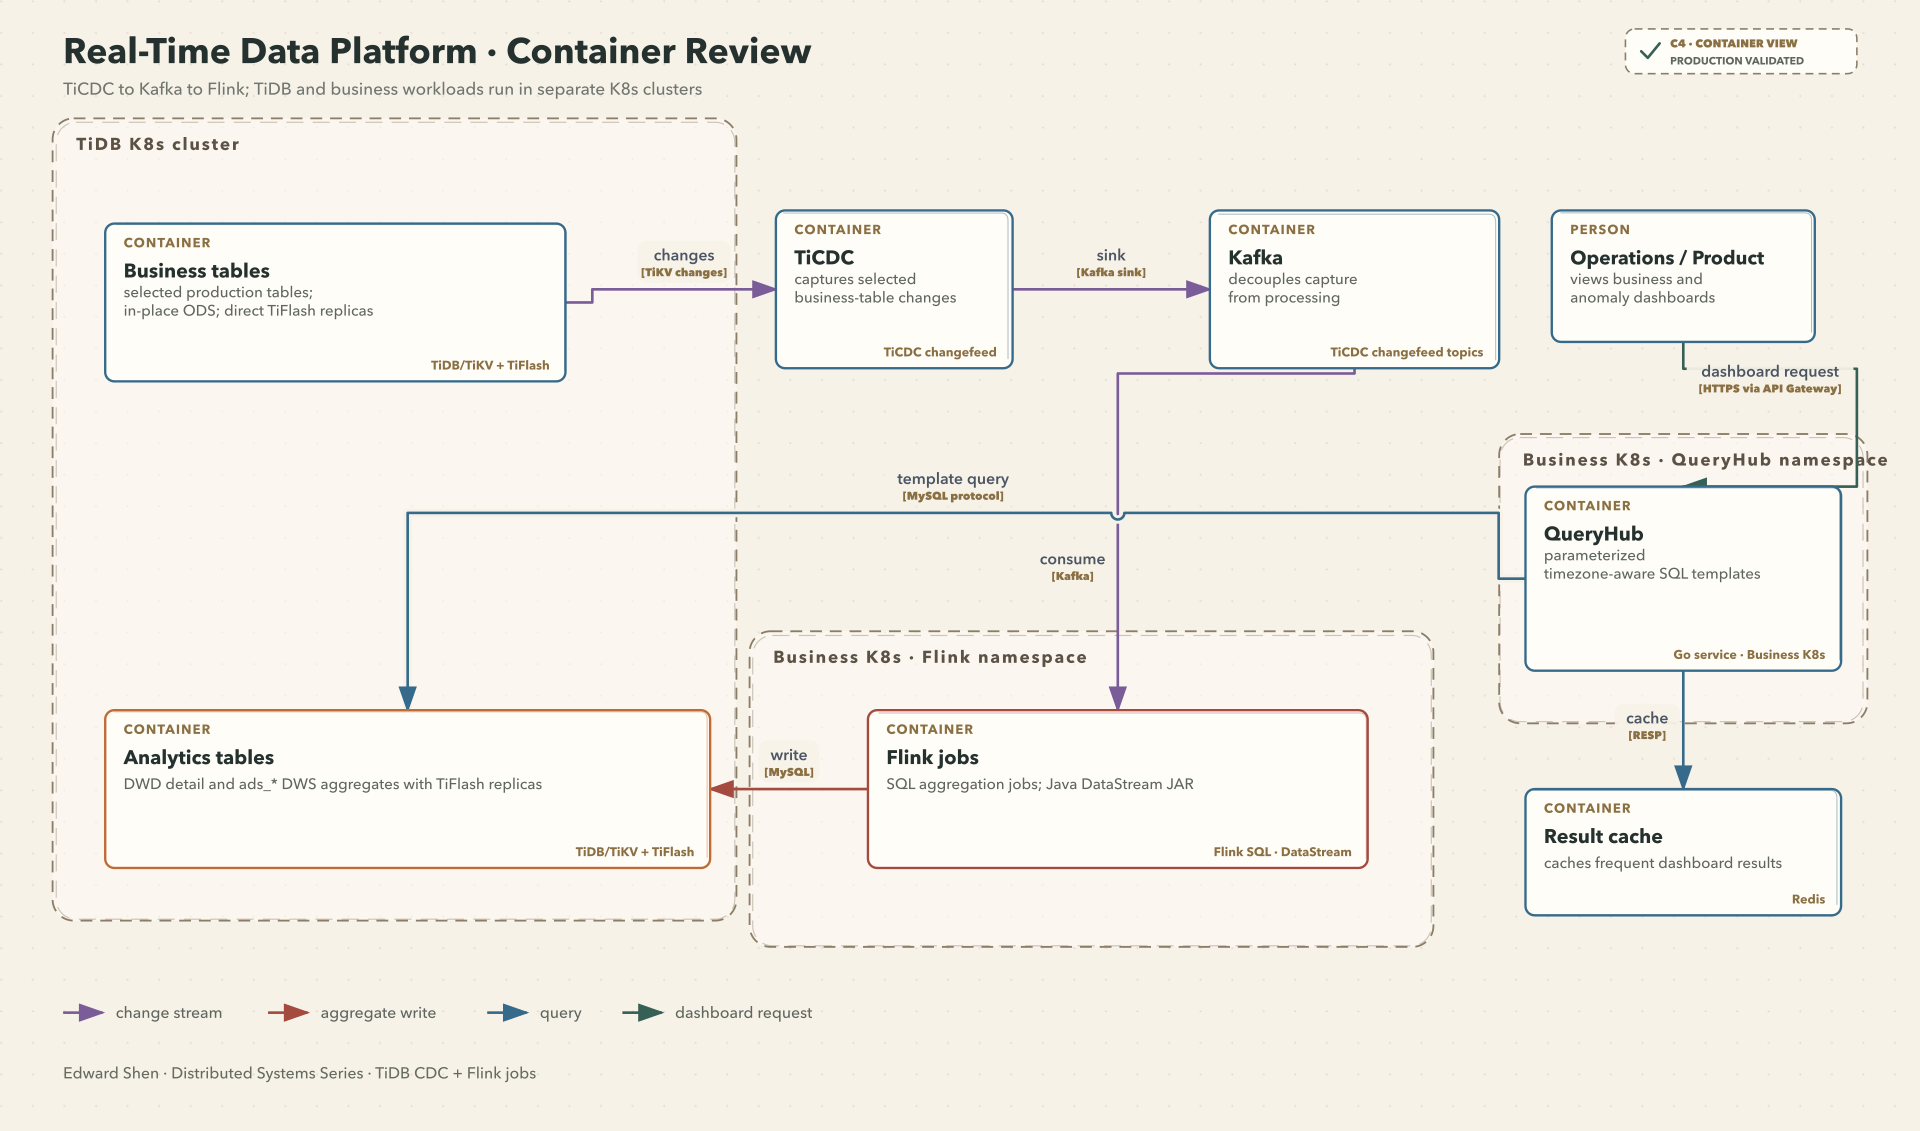
The captured sources covered transaction settlements, order amounts, referral/commission ledgers, promotion records, and wallet transfers.
Key Technical Decisions
SQL-first processing
SQL jobs produced hourly aggregate rows keyed by bucket time and business dimensions. A separate DataStream JAR handled workloads that needed custom state or event cleaning: it owned user-session state driven by device and transaction events, and cleansed standard-operating-procedure (SOP) lifecycle-management data. This kept most metrics reviewable while isolating timers, keyed state, and change-only output.
Idempotent hourly aggregates
Each hourly aggregate table used the bucket start timestamp plus business dimensions as its primary key. Flink JDBC sinks upserted those keys, so early fires, checkpoint restarts, or batch reruns replaced the same row instead of creating duplicates.
1 | -- Simplified Flink sink shape; several hourly tables followed this pattern. |
Airflow scheduled the H+1/T+1 offline jobs used for reconciliation. The batch lane handled historical backfill and selected incremental recovery after a pipeline fault; jobs reread a selected time range and recalculated the same keys. Streaming and batch paths therefore shared one serving table; that avoided a separate reconciliation target but increased contention on the TiDB cluster and required closer attention to TiFlash sync capacity.
QueryHub template service
I designed and built QueryHub, the SQL-template service. It stored named SQL templates as versioned configuration. A template carried its data source, SQL, parameters, cache policy, status, and version. Query execution became a configuration change rather than a new Go handler, route, DTO, and deployment. Reviewed SQL seeds were still required, and a new visualization could still require frontend wiring.
Redis keys included the template name, sorted-parameter hash, and cache-group version. Hot queries reused results while related templates could be invalidated together. Reviewed templates exposed metric definitions, parameters, cache invalidation, and access as configuration.
Timezone-aware reporting
Streaming jobs wrote UTC millisecond buckets. QueryHub templates
accepted a :time_zone parameter, converted report
boundaries to UTC, and grouped stored buckets into viewer-local dates or
months. Templates generated date/month series, left joined aggregates
onto them, and filled inactive periods with zero. The same physical rows
supported different local reporting boundaries and consistent MoM/YoY
comparisons.
Implementation
The platform spanned two Kubernetes clusters. TiDB, PD, TiKV, and TiFlash ran in a dedicated TiDB K8s cluster, while TiCDC captured their changes into Kafka. Flink and QueryHub ran in the business K8s cluster, in different namespaces. That boundary separated database workloads from business-service deployments, but it did not isolate the analytical path from production TiDB capacity: TiCDC read source tables, Flink and reconciliation wrote derived tables, and TiFlash maintained replicas and served scans on the same TiDB cluster.
| Component | Ownership / role |
|---|---|
| Flink SQL | Streaming aggregation, multi-stream joins, and reconciliation |
| DataStream JAR | User online/session state and SOP (standard-operating-procedure) lifecycle-management cleansing |
| TiDB / PD / TiKV | MySQL-compatible serving and row storage for production and derived tables |
| TiFlash | Columnar replicas for analytical queries |
| TiCDC | Change capture into Kafka |
| QueryHub | SQL templates, parameter binding, caching, and query API |
Each metric followed the same rollout path: Flink job,
ads_* table, optional TiFlash replica, QueryHub template,
and frontend chart mapping.
For dashboard queries, the admin frontend called QueryHub's named-query API through the gateway. QueryHub returned generic tabular rows, which ECharts rendered in the existing React admin.
When TiFlash Freshness Fell Behind
The first production problem was TiFlash storage sizing. Its data volumes initially used cloud-volume defaults, which left too little headroom for the replica's concurrent workloads. During peak periods, TiDB monitoring raised alerts for replica synchronization lag and related freshness metrics; analytical tables also looked stale. Writes, replica maintenance, and analytical reads competed for the small per-volume IOPS budget.
TiKV had its own floors: SSD storage (preferably NVMe/PCIe), since TiDB writes became Raft-replicated row storage that TiCDC read, and IOPS/throughput headroom for TiKV's RocksDB LSM (Log-Structured Merge-tree) path — queueing there raised write and Raft latency even without TiFlash contention. The incident surfaced on TiFlash first because columnar replicas added a second storage workload with scans, merge/compaction, and synchronization traffic.
Each TiFlash data volume moved from the cloud-volume default to 40,000 provisioned IOPS. With two TiFlash nodes, the layer had 80,000 IOPS in aggregate, but each volume still had an independent budget rather than a shared cluster-wide pool. After the change, the peak-period alerts stopped, TiFlash replicas kept up with the streaming path, and second-level freshness became dependable in normal operation.
This choice also changed cost. The TiFlash layer added dedicated nodes and higher per-volume provisioned IOPS, so each analytical replica increased baseline storage and IOPS cost as well as query load. We paid for that choice with more storage headroom and provisioned IOPS rather than operating a separate OLAP service.
Hardware floors alone were insufficient for sizing TiFlash. I would size it separately from TiDB HA node floors, using changed-row volume, replica sync traffic, scan shape, compaction pressure, and freshness targets.
TiFlash also added an operational checklist. Creating an
ads_* table did not automatically enable its TiFlash
replica; we ran the replica DDL separately and verified that the table
was queryable before calling the dashboard production-ready.
Results
The platform moved dashboards from ad-hoc production queries to a repeatable pipeline. TiCDC change volume peaked above 1,000 changed rows per second; that figure was the capacity reference for Kafka partitioning, Flink parallelism, and TiFlash sizing. Online Grafana dashboards also recorded roughly 10–20 million transaction-related gRPC calls per day, with peaks of at least 500 calls per second, but those numbers measured request pressure rather than TiCDC rows or inserts. The Flink jobs covered transaction/settlement, promotion, commission-ledger, wallet-transfer, campaign, and online/session data; the Java DataStream JAR added SOP lifecycle-management cleansing.
| Outcome | Evidence | Engineering effect |
|---|---|---|
| Near-real-time analytics | Second-level OLTP-to-analytics freshness | Enabled active-campaign monitoring instead of T+1 review |
| Controlled analytical read path | QueryHub read analytical tables and cached hot queries | Reduced uncontrolled production-table scans |
| Reporting as configuration | More than 100 parameterized SQL templates | New query-backed metrics could be added through configuration |
| Consistent linked dashboards | Cache groups and keyed hourly aggregates | Linked views used the same metric definitions |
| Targeted reconciliation | Batch rewrote the same hourly keys | Corrected selected ranges without rebuilding serving tables |
| Ledger reconciliation | Covered settlement and commission ledgers | Supported repeatable reconciliation |
Trade-offs
Analytics shared the production TiDB cluster's capacity and operational path, coupling analytical pressure to production performance. QueryHub reduced service-code work, but metric review and frontend wiring remained necessary.
I would keep TiCDC → Kafka → Flink and the idempotent TiDB sinks, but size the shared cluster for analytical work earlier. Managing production and analytical tables together saved staffing effort; the cost was that an analytical freshness incident became a shared TiDB capacity problem.
Before changing storage, I would keep dashboards on analytical tables only, set QueryHub query limits and timeouts, and isolate batch reconciliation windows. The useful alerts group by path: pipeline lag covers TiCDC lag, Kafka partition skew, and Flink checkpoint duration; the write path covers JDBC upsert rate and TiKV write latency; the serving engine covers TiFlash replica lag, disk IOPS and latency, and compaction activity. Those groups would localize pressure to capture, processing, writes, or serving rather than only announcing that the shared cluster was busy.
If analytical scans or production-latency risk kept growing, I would
move analytical detail and ads_* serving out of the
production TiDB cluster while preserving the pipeline. ClickHouse could
suit sustained detail scans and long retention, but it would change
correction semantics: the current correction path relies on keyed TiDB
upserts, while ClickHouse would require explicit ordering,
merge/deduplication, and correction behavior. I would consider that
migration when sustained scan cost, retention, and query concurrency
justified it.
Previous in this series: Scaling Four Engineers to Eighteen Go Services with Generated Contracts.
Next in this series: Building a Predicate-Driven Audience Pipeline for Lifecycle Email.