The alert came from Grafana. A Go service on the SOP event chain reached its 8 GB Pod memory limit and restarted; process memory went from flat to the limit in under a second, with no correlation to traffic or time of day.
The service ran across twelve pods, supporting SOP workflows for more than 30,000 enterprise customers. It consumed close to ten million events per day and supported daily outreach to hundreds of thousands of end users. The alerts kept coming for over a week: on most days a burst — one pod lost, then another within minutes as if the failure moved between them — and three or four on the worst days, until each burst exhausted itself and went quiet. Nothing in the standard instruments captured why.
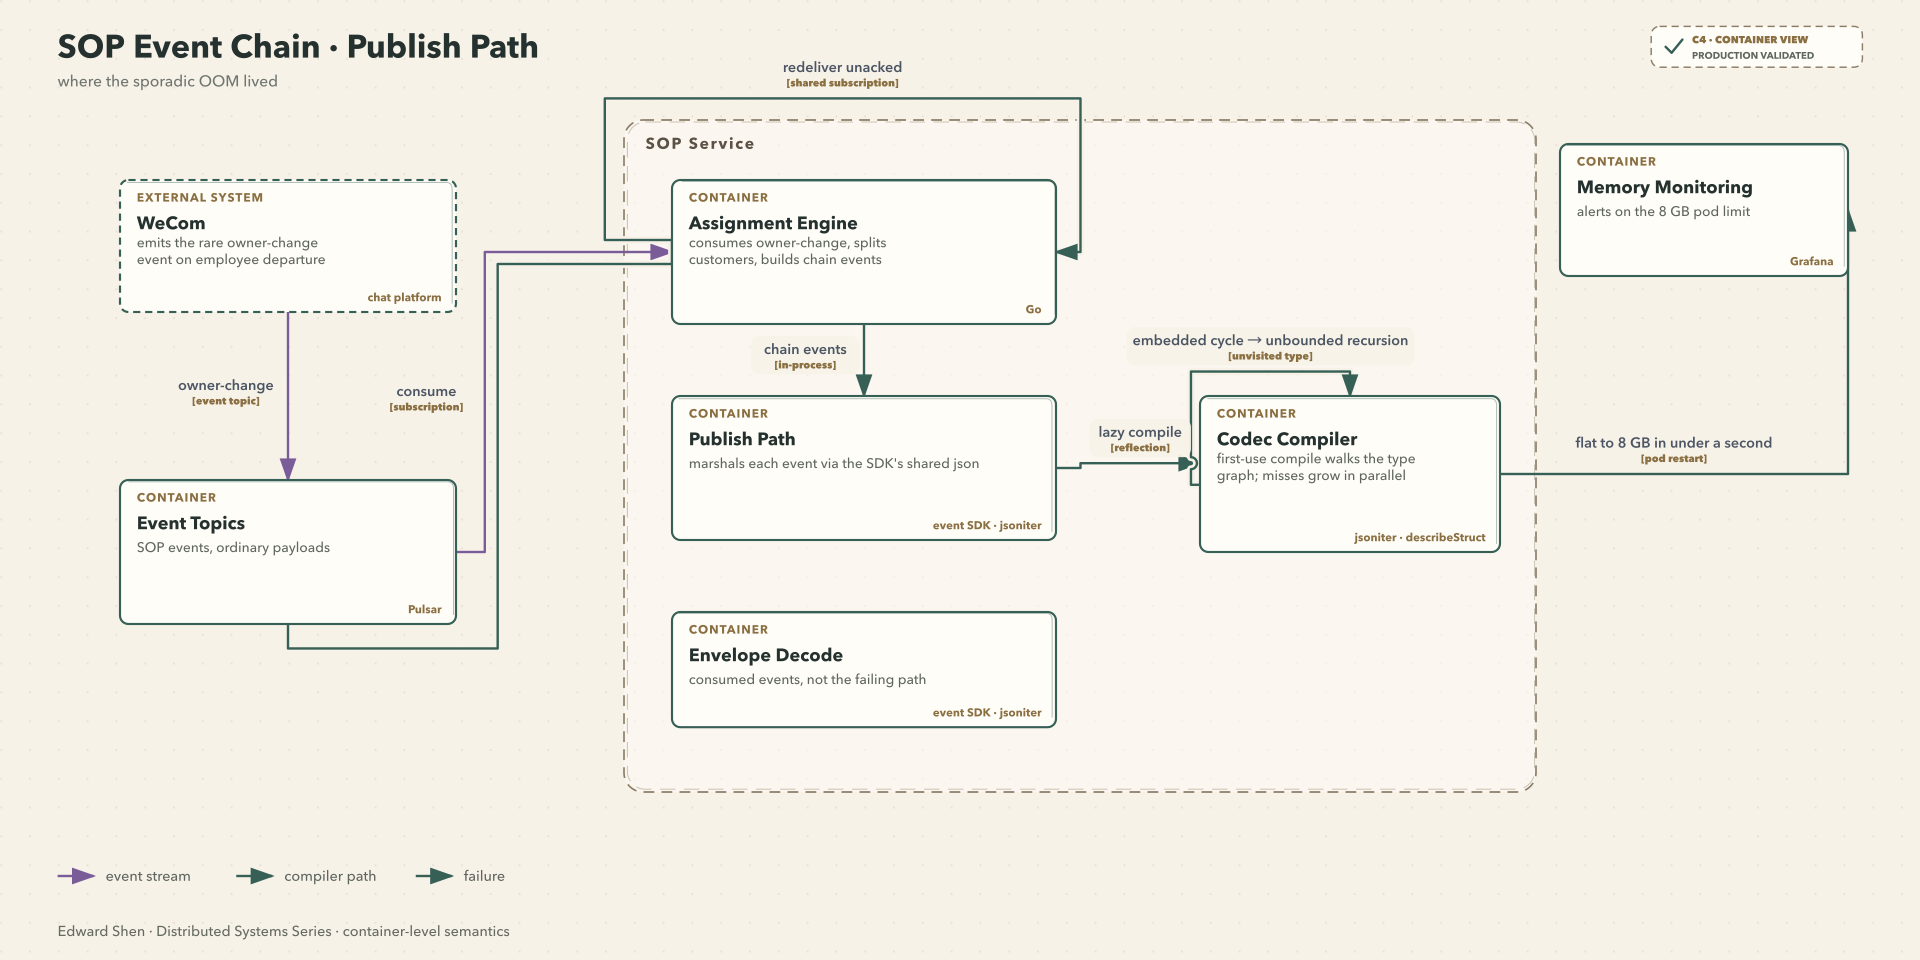
Events moved through this service in both directions: it consumed
upstream events through the SDK's envelope decoder, and published its
own events back through the same SDK's json package. Each
event type had its own code on the wire and its own handler.
This was the second memory incident on that path in a short window,
and the two looked nothing alike. The first was a slow climb: memory
rose with business peaks and eventually reached the limit. I had already
fixed that one: on March 7 I moved the JSON package behind three
internal SDK paths — the event SDK's shared json, a cache,
and an executor SDK — from encoding/json to jsoniter. At our consume
rate, stdlib's unmarshal allocated heavily per event; jsoniter reused
its read buffers, memory fell back and stayed down. Because it was one
package-level swap, decode and publish both went through jsoniter from
then on.
Days later, a feature iteration landed in this service. It consumed WeCom's owner-change event — an employee departs, WeCom hands their customers over — and this service's assignment engine distributed those customers among the remaining staff by rule, publishing an assignment event for each split. Departures are rare — a handful per tenant per month — so these events were a small fraction of the millions of daily events. The feature had shipped once before with a flat event type, verified end to end by the automated suite on a test tenant.
The second iteration added chain support: a departing employee's
customers could exceed one receiver's capacity, so the assignment engine
re-dispatched the remainder to the next receiver, and that dispatch was
itself an assignment event. Each re-dispatch carried the assignment it
continued, so the engine could audit how one departure was split and
deduplicate overlapping splits. Every step of that chain was the same
event type, so the field carrying the previous assignment pointed at the
type itself — an anonymous embedded pointer, the event layer's standing
convention. Every event in the chain was published through the SDK's
json package, the one I had just switched to jsoniter. The
alerts that followed were this article's subject: a growth curve points
at accumulation, a spike at a single allocation path gone wrong, and the
instruments that watched the first had nothing to say about the
second.
The migration left jsoniter behind every JSON touchpoint in the service: envelope decode, cache, an executor SDK, and the publish path. The first three were dependency pins, swappable one at a time. The publish path was event-layer business code and shipped only inside the event SDK's builds. That distinction decided how the suspicion could be tested, and later how the failure was isolated.
What the failing instrumentation could not see
Four standard instruments were considered:
- Logs: the triggering events were ordinary, and the process died before the consumer could record its state.
- Scheduled pprof sampled too infrequently to catch a sub-second spike.
- Threshold-triggered pprof threw false positives from normal allocation and could still miss a jump between polls.
- Core dumps: the memory-limit kill sent
SIGKILLbefore a core could be written.
All four needed the process to survive long enough to leave evidence; this one did not. After a week it had no time signature — what it most plausibly indexed was the set of recent changes on the JSON path, which only the build could step through one at a time.
The codec suspicion
The JSON change I knew about was my own March 7 migration, so jsoniter was the first suspect. On March 11 I swapped it for sonic on the cache path — a dependency swap. The publish path, business code inside the SDK builds, was beyond that kind of swap and stayed on jsoniter. The OOM recurred within a day; I rolled sonic back the next morning.
That experiment ruled out the cache path, not jsoniter as a whole. Jsoniter still ran on the envelope, the executor SDK, and the publish path. No dependency swap could reach those remaining paths; stepping the SDK builds could. I stopped swapping libraries and started bisecting builds, treating the recent JSON changes as a single bundled delta.
The bisection
On March 12 I rolled back to the last known stable build and bisected the incident delta — one staged deploy and observation window per step, eight days across eight rollbacks. The rollback gave a baseline, not an answer — pods still died daily, so a quiet window proved nothing. The builds stepped the internal event SDK between versions that carried the new concrete event type and versions that did not; jsoniter itself never moved. The SDK version was the deployable handle for the bundled change: subscription-layer code and its dependency pins shipped together, so stepping it moved the new event type in and out of the process.
The bisection isolated the build delta that introduced the concrete
event type. Tracing it through the service: the engine built each chain
event and published it through the SDK's json package,
where jsoniter lazily compiled an encoder for the type. The reduced
TransferEvent case reproduced the resulting unbounded
traversal locally.
The mechanism, reconstructed
The production type graph is reconstructed as containing the anonymous embedded-pointer cycle; the business shape below is likewise a reconstruction of the iteration's semantics, not a transcript of its fields.
jsoniter compiles
a codec on first use — encoder and decoder share the same type walk
— before the first byte is read or written. Named recursive fields are
bounded by jsoniter's placeholder
codec. An anonymous embedded pointer takes a different path: describeStruct
recursively expands the embedded struct without a visited-type
guard. The decode
depth limit is downstream and cannot protect a process that dies
while compiling the codec.
1 | // jsoniter v1.1.12, reflect_extension.go:348-373, abridged |
1 | type TransferEvent struct { |
Why production became an OOM
The incident ran on Go 1.18, and the reduced case reproduces there
with jsoniter v1.1.12 — the version the service had pinned.
The same case reproduced in every release from v1.1.5
through v1.1.12, while the standard library and a named
recursive pointer field remained safe.
Production ran multiple goroutines inside an 8 GB Pod, and jsoniter compiled codecs lazily — concurrent first-use misses could place several goroutines in the same recursive path, so process memory grew in parallel and the Pod limit could arrive before any single goroutine hit its own stack limit. The harness below demonstrates that arithmetic. Most Pods never received a rare assignment event at all. Because the spike ended too quickly for a useful profile, the exact RSS contribution from goroutine stacks, heap objects, and runtime allocations remains unknown.
The publish call never returned: the assignment event the engine was emitting never reached the broker, and the owner-change message the service had consumed to trigger it was never acknowledged either. When the Pod was OOM-killed, its consumer connection closed with that message unacknowledged, and the shared subscription redelivered it to another Pod, where the same chain repeated the failure. This was consumer-disconnect redelivery, not an application-issued nack — the OOM never advanced any retry counter. The burst ended only when the message exhausted its redelivery budget and landed in the dead-letter topic: each departing employee's event burned through a handful of pods, then went quiet. We only found that out during the retrospective — nobody had looked at the dead-letter topic during the week of debugging, though it held the failing messages, their retry trails, and the event code that would have pointed at the trigger from day one.
The harness below reproduces that loop locally as a single copy-paste program, scaled down 16× (64 MB stack walls instead of Go's ~1 GB default) and with the pod limit simulated by an RSS threshold. Each child process is one "pod": eight goroutines hit the same first-use compile, and the parent replays the unacknowledged message every time the child dies:
1 | // Command oom-harness reproduces the incident's cross-pod cycle in miniature. |
1 | redelivery 1: pod died in 100ms, peak RSS 773 MB — over the 300 MB pod limit: an OOMKill before any single 64 MB stack wall |
The peak scales with concurrency — eight goroutines × one stack each — which is the arithmetic behind the production OOM: process memory grew in parallel while the stack limit only ever guarded one goroutine at a time. On this laptop the child still dies to the stack wall — no cgroup exists to kill it first. Inside a real container limit, the memory wall arrives first, the process dies without a word, and the parent's redelivery loop replays the cross-pod cycle the incident showed.
Two controls in the harness's style isolate the trigger — same call, same shape, one property changed each time:
1 | // Named recursive field: jsoniter's placeholder codec terminates compilation. |
The standard library uses a visited
map when resolving fields — the very function jsoniter's branch
lacks. The same domain shape had been serialized under
encoding/json since the feature first shipped; only
jsoniter's compilation entered the failing traversal.
Sonic avoids the failing traversal at the field-resolution step. In
v1.14.0, its resolver delegates
to encoding/json.typeFields; in v1.14.1
and v1.15.4, it performs that traversal locally with
a visited-type map. Both approaches stop revisiting the anonymously
embedded type. Separately, sonic's JIT and optimized codec compilers track
types already being compiled and handle recursive fields without
repeatedly expanding their work. For this embedded-cycle case, the
field-resolution guard is the relevant protection. These are
retrospective checks (Go 1.24.9, macOS, JIT and optimized
paths both ways); they verify the reduced case, not the production sonic
version or runtime.
Why the automated suite stayed green
The suite that had verified the first release stayed green for a mechanical reason. It exercised the real chain on a test tenant — simulate a departure, let the engine publish, consume — but by the time this iteration ran, that tenant's engine had been switched off for a parallel feature's testing, and nothing flagged the gap — a green run looked exactly like an empty one. With the engine off, no assignment event was ever built; nothing published; and jsoniter compiles a codec only on first use — zero publishes meant zero compilations. The green was real but empty: no test ever reached this change. Unit tests could not either — they call the engine with struct literals and never serialize an event.
The fix
With the cause isolated, the fix followed directly: the publisher
took its own sonic reference instead of the SDK's shared
json, so the envelope and every other consumer of that
variable kept jsoniter. I validated the move first against the reduced
reproduction, which sonic encodes without entering the failing
traversal. The jsoniter migration kept the win it had already delivered:
the envelope and cache paths stayed on it, and the slow-climb incident
did not come back. Fixing the type instead (adding a field name or tag
to break the anonymous embedding) would also have closed this failure,
as the named-field control demonstrates; the migration was chosen
because it left the shared event contract untouched while covering every
event type at once.
The production OOM stopped after the migration and never recurred through the months that followed, while the service kept running until I left the company. These results make the publish-path encoder the strongest operational explanation for the OOM. They do not identify the exact production RSS split between goroutine stacks, heap, and runtime allocations; the spike ended before a useful profile could be captured. The type graph itself remained unchanged; the source comparison in the previous section explains why sonic handles the embedded cycle.
Lessons from the investigation
- The shape of the failure decided the tool. A sub-second spike with no time signature ruled out accumulation, pointed at a single allocation path, and made every runtime instrument useless — the process died before leaving evidence. I lost days to codec swaps and quiet windows before accepting that; build bisection was the expensive but only decisive step — eight rollbacks to one delta. For a fast-fatal failure, read the shape first and step builds early.
- I swapped one package-level
jsonvariable to fix slow memory growth and silently moved the publish path to jsoniter with it. Now, before any dependency swap, I list every caller of what I'm touching. - The dead-letter topic held the failing messages and their retry trails for the whole week we chased the OOM; we found it in the retrospective. Now a consumer incident starts with DLQ depth and retry counters, before any profiling.
Previous in this series: Running a Million-DAU Casual Game on Go: Rooms as the Concurrency Boundary.
Next in this series: Building a Production Go Scheduler for 200K+ Delayed Jobs per Second.